

Track these eight booking analytics metrics now: completion rate, cancellation rate, no-show rate, average lead time, booking velocity, resource utilization, channel mix, and repeat booking rate. Your immediate next step is to pull 30 days of raw booking data from your calendar or scheduling system and calculate a baseline for each one before changing anything else.
Quick metric definitions:
- Completion rate: Appointments completed ÷ total scheduled × 100%
- Cancellation rate: Cancelled bookings ÷ total bookings × 100%
- No-show rate: No-shows ÷ total scheduled × 100%
- Average lead time: Mean number of days between booking creation and appointment date
- Booking velocity: Number of new bookings created per day or week
- Resource utilization: Booked hours ÷ available hours × 100%
- Channel mix: Percentage of bookings originating from each source (web, phone, app, walk-in)
- Repeat booking rate: Returning customers ÷ total customers × 100%
A 30-day baseline tells you where you actually stand, not where you think you do.
Key Takeaways
Tracking a focused set of booking analytics metrics, starting with completion rate, utilization, and lead time, is the fastest path to fewer double-bookings and better staff efficiency.
| Point | Details |
|---|---|
| Start with three metrics | Completion rate, utilization, and lead time deliver the most diagnostic power before expanding to secondary KPIs. |
| Clean schema first | Capture booking_id, status, source_channel, and UTC timestamps on every record or your metrics will mislead you. |
| Schedule adherence target | Realistic schedule adherence targets run 85–95%; utilization should stay between 70% and 90% per staff member. |
| Alert rules prevent lag | Configure real-time alerts for same-day cancellation spikes and double-booking attempts so issues surface in minutes. |
| Expressbook accelerates setup | Expressbook’s real-time availability, automated reminders, and QuickBooks/Xero sync map directly to the core metrics above. |
Table of Contents
- Why tracking booking analytics metrics changes your outcomes
- What booking metrics should you actually measure?
- How do you collect and structure booking data reliably?
- What dashboards and reports should you build?
- How do you turn metric signals into operational fixes?
- What does a 30–90 day implementation look like?
- What data-quality problems break your booking metrics?
- How does Expressbook map to these metrics?
- How do you set up real-time alerts for booking anomalies?
- Can predictive analytics help you prevent scheduling conflicts?
- How does customer segmentation improve your scheduling strategy?
- What metrics should small service businesses prioritize first?
- Expressbook: built for service businesses that want data, not guesswork
- Expressbook is the scheduling platform this article was written around
- Sources
Why tracking booking analytics metrics changes your outcomes
Measuring scheduling KPIs systematically does two concrete things: it surfaces double-booking risk before it hits a client, and it shows you exactly where staff time is being wasted. Both problems cost money and reputation.
Consider a mid-size wellness clinic running 12 practitioners. Without utilization data, managers assume everyone is equally busy. With it, they typically find two or three practitioners running at 90%+ capacity while others sit at 55%. Redistributing demand across staff reduces burnout and captures revenue that was quietly walking out the door.
No-show reduction is equally measurable. Automated reminders tied to booking records, a standard feature in scheduling platforms, consistently lower no-show rates by reducing the gap between “I forgot” and “I confirmed.” Scheduling KPI guidance recommends starting with three high-value KPIs, specifically on-time delivery, schedule adherence, and utilization, before expanding to secondary metrics. Schedule adherence targets above 85% are generally realistic for most service operations.
Expressbook’s real-time availability engine prevents double-bookings at the source, while its AI analytics surface utilization gaps and channel performance without requiring a data analyst.
What booking metrics should you actually measure?
Standard booking reports include reservation volume over time, cancellation rates, lead-time distribution, booking velocity, and channel conversion, with formulas like Cancellation Rate = Cancelled ÷ Total × 100% and Repeat Rate = Returning ÷ Total × 100%.
| Metric | Formula | Frequency | Quick action if it drifts |
|---|---|---|---|
| Completion rate | Completed ÷ Scheduled × 100% | Daily | Investigate cancellation and no-show drivers |
| Cancellation rate | Cancelled ÷ Total × 100% | Weekly | Add cancellation-reason field; adjust policy |
| No-show rate | No-shows ÷ Scheduled × 100% | Weekly | Enable timed reminders; require prepayment |
| Average lead time | Sum of (appt date − created date) ÷ count | Weekly | Adjust marketing timing to booking window |
| Booking velocity | New bookings per day or week | Daily | Spot demand drops early; trigger promotions |
| Utilization | Booked hours ÷ Available hours × 100% | Weekly | Rebalance staff schedules; add flex slots |
| Channel mix | Bookings per channel ÷ Total × 100% | Monthly | Shift budget toward highest-converting channel |
| Repeat booking rate | Returning ÷ Total × 100% | Monthly | Trigger re-engagement campaigns for lapsed clients |
| Average booking value (ABV) | Total revenue ÷ Total bookings | Monthly | Upsell lower-ABV segments; review pricing tiers |
Copy-ready spreadsheet formulas:
- Cancellation rate:
=COUNTIF(status_range,"Cancelled")/COUNTA(booking_id_range)*100 - Utilization:
=SUM(booked_hours_range)/SUM(available_hours_range)*100 - Repeat booking rate:
=COUNTIF(visit_count_range,">1")/COUNTA(customer_id_range)*100
Booking curve analysis adds a time dimension, showing when customers convert relative to the appointment date, which informs both pricing and marketing timing.
How do you collect and structure booking data reliably?
Good appointment analytics start with a clean event schema. Every booking record should capture these fields at minimum:
booking_id(unique, non-null)customer_idresource_idandstaff_idstart_time_utcandend_time_utc(always UTC, convert for display)status(scheduled, completed, cancelled, no-show)source_channel(web, app, phone, walk-in, voice agent)created_atandcancelled_atpayment_statusandpayment_amount
Data sources to connect: your booking page, calendar sync (Google Calendar), POS or payment gateway, manual entry logs, mobile app events, and Expressbook’s voice agent logs for same-day and accessibility-driven bookings. For revenue fields, Expressbook’s QuickBooks and Xero integration maps payment amounts directly to booking records, keeping ABV and revenue reconciliation accurate without manual exports.
Pro Tip: Store all timestamps in UTC and apply timezone conversion only at the display layer. When daylight saving time shifts, UTC-stored records stay consistent. A booking created at 11:00 PM EST on November 2 and one created at 11:00 PM EST on November 3 will sort correctly in UTC; local-time storage creates a one-hour gap that corrupts lead-time calculations.
Channel attribution requires a rule: the source_channel field should reflect where the booking originated, not where the reminder was sent. Voice agent bookings in Expressbook log as a distinct channel, which matters when you calculate channel mix and conversion.
What dashboards and reports should you build?
Build four views: a Booking Curve (line chart of new bookings per day plotted against appointment date), a Utilization Heatmap (staff × time slot grid), a Channel Mix funnel (stacked bar by source), and a Staff Load Forecast (projected booked hours per staff member over the next 14 days).
Booking curve and search-to-book behavior analysis reveals when customers convert relative to the appointment date, enabling you to time promotions and pricing adjustments to the actual booking window rather than guessing.
| Cadence | What to review | Who receives it |
|---|---|---|
| Daily | Booking velocity, same-day cancellations, double-booking flags | Operations lead, front desk |
| Weekly | Completion rate, no-show rate, utilization by staff | Manager, operations lead |
| Monthly | Channel mix, ABV, repeat booking rate, lead-time distribution | Owner, finance |
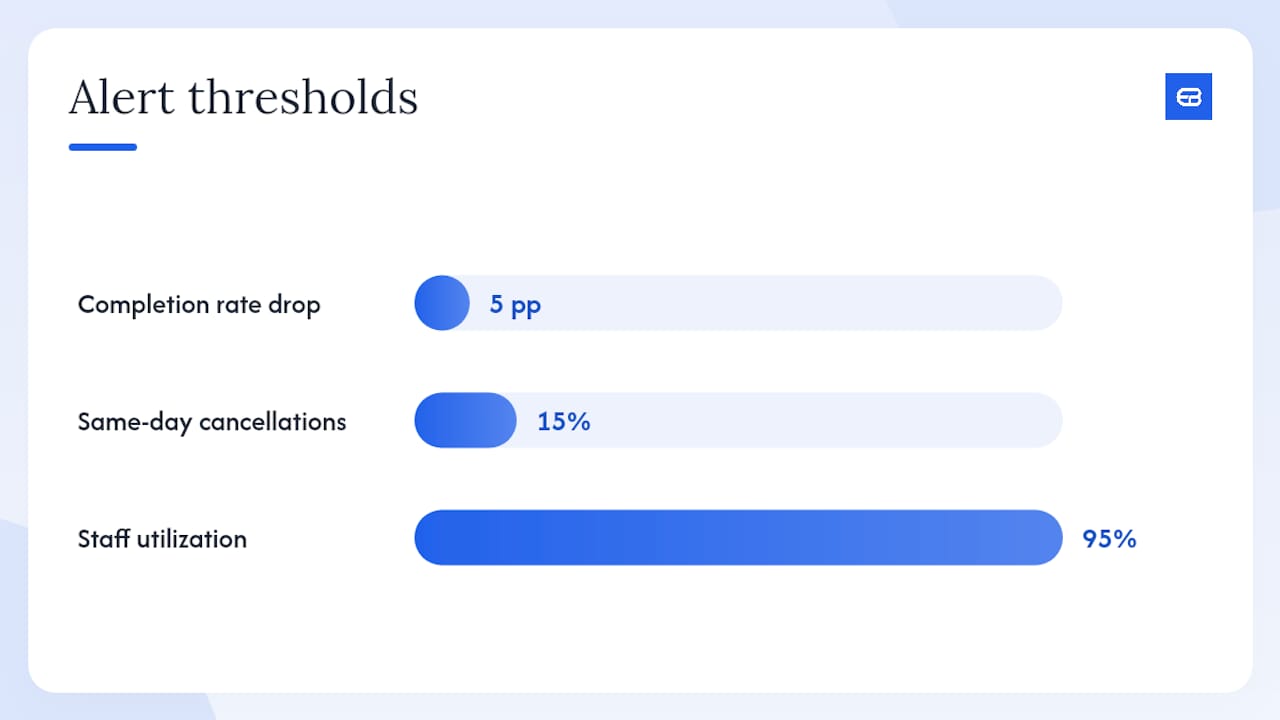
Set alert rules: trigger a notification when completion rate drops more than 5 percentage points week-over-week, when same-day cancellations exceed 15% of the day’s schedule, or when any staff member’s utilization exceeds 95% for three consecutive days. Analytics platforms that support multi-period trend comparison and natural-language queries convert routine questions into decision-ready outputs and reduce the time managers spend building manual reports.
How do you turn metric signals into operational fixes?
Each metric has three to five concrete remedial steps. Run this sequence when any metric crosses a threshold: detect the anomaly, diagnose the root cause, act on the most likely driver, then measure the result after 14 days.
Reduce double-bookings:
- Enable real-time availability locking so no two bookings can claim the same slot simultaneously.
- Add buffer windows (10–15 minutes) between appointments for each resource.
- Set staff-level booking limits per hour.
- Audit
booking_iduniqueness weekly to catch duplicate records. - Review voice agent and mobile app logs for concurrent booking attempts.
Reduce no-shows (target: cut no-show rate by 3–5 percentage points within 60 days):
- Send a reminder 48 hours before the appointment, then again 2 hours before.
- Require partial or full prepayment for new clients or high-value slots.
- Offer a one-click reschedule link in every reminder.
- Track no-show rate by channel to identify which booking sources produce the most unreliable clients.
Optimize staff schedules:
- Set a utilization floor of 70% and a ceiling of 90% per staff member per week.
- Flag anyone below 70% for cross-training or schedule consolidation.
- Use lead-time distribution to predict demand 7–14 days out and adjust shift assignments accordingly.
What does a 30–90 day implementation look like?
| Phase | Timeline | Key tasks |
|---|---|---|
| Baseline | Days 1–30 | Export 30 days of booking data; calculate all 8 metrics; configure automated reminders; enable calendar sync |
| Build | Days 30 to 60 | Deploy Booking Curve and Utilization Heatmap dashboards; set channel attribution rules; connect QuickBooks/Xero |
| Optimize | Days 60 to 90 | Run predictive staffing model; activate alert rules; review first full monthly report; expand to secondary metrics |
Quick wins you can act on this week:
- Enable automated reminders in your booking platform.
- Add
source_channelto every new booking record. - Pull a cancellation rate calculation for the last 30 days.
- Confirm all timestamps are stored in UTC.
Roles: the owner sets KPI targets and reviews monthly reports; the operations lead owns daily and weekly dashboards; the front desk or admin ensures source_channel and status fields are completed on every booking; finance maps payment fields to QuickBooks or Xero; IT or your platform admin configures integrations and alert rules.
What data-quality problems break your booking metrics?
Most inaccurate metrics trace back to three causes: inconsistent status values, missing timestamps, and unattributed channels. A booking marked “cancelled” in your calendar but “completed” in your payment system inflates completion rate and understates cancellation rate simultaneously.
Red flags to watch:
- More than 10% of bookings missing a
source_channelvalue - Duplicate
booking_idvalues in any export cancelled_attimestamps that predatecreated_at- Timezone-naive timestamps mixed with UTC records
- Manual bookings entered without a status update after the appointment
Data governance checklist:
- Validate
booking_iduniqueness on every import. - Enforce non-null rules on
status,start_time_utc, andsource_channel. - Run a nightly reconciliation between your booking system and payment gateway.
- Review voice agent logs weekly for incomplete records.
- Audit
cancelled_atvs.created_atordering monthly.
Pro Tip: Refunds and partial cancellations require a separate flag. A booking where 50% of the fee was refunded is not a clean “completed” record. Add a refund_status field and exclude partial refunds from ABV calculations while keeping them in completion rate, so both metrics remain meaningful.
How does Expressbook map to these metrics?
Expressbook provides the integrations and real-time availability needed to measure and act on booking performance indicators from day one.
- Real-time availability prevents double-bookings by locking slots the moment a booking is confirmed.
- Automated reminders reduce no-show rates without manual follow-up.
- QuickBooks and Xero sync keeps ABV and revenue reconciliation accurate, eliminating the manual exports that corrupt financial metrics.
- Mobile app (available for both clients and admins) captures same-day bookings and status updates in real time.
- Voice agent logs accessibility-driven bookings as a distinct channel, so channel mix data stays complete.
- AI analytics surface utilization gaps and booking velocity trends without requiring a dedicated analyst.
Expressbook claims time savings of over 10 hours per week by automating reminders, reconciliation, and reporting. Expressbook has no subscription, so you can complete the full 30–90 day implementation plan on prepaid credits. Start by enabling calendar sync and automated reminders in week one; those two steps alone address the most common sources of no-shows and double-bookings.
For multi-location operations, the multi-location scheduling guide covers how to extend utilization and channel mix tracking across sites.
How do you set up real-time alerts for booking anomalies?
Real-time alerts close the gap between a metric moving and a manager noticing. The goal is to detect anomalies within minutes, not at the next weekly review.
Configure webhook-based or platform-native alerts for these triggers: a sudden drop in booking velocity (more than 30% below the 7-day average), a spike in same-day cancellations (above 15% of the day’s schedule), any double-booking attempt flagged by the availability engine, and a staff utilization reading above 95% for a single day.
Route alerts by severity. Operational alerts (double-booking attempts, same-day cancellation spikes) go to the front desk and operations lead immediately. Strategic alerts (weekly velocity drop, utilization trend) go to the manager in a digest at the start of each day. Keeping the two streams separate prevents alert fatigue, which is the primary reason teams disable notifications and miss real problems.
Can predictive analytics help you prevent scheduling conflicts?
Predictive methods shift your posture from reactive to proactive. Instead of responding to a no-show after it happens, you identify which bookings carry the highest no-show probability and intervene before the appointment.
A basic predictive model uses three inputs: historical no-show rate by channel, lead time, and client visit history. Bookings made more than 14 days in advance through lower-converting channels, from first-time clients, carry statistically higher no-show risk. Flag those records automatically and apply a prepayment requirement or an extra reminder step.
For demand forecasting, booking curve analysis shows how bookings accumulate in the days before an appointment date. A curve that is tracking below its historical average at the 7-day mark signals a slow period ahead, giving you time to run a targeted promotion before the slot goes unfilled. Combining booking curve data with revenue evolution, as Amadeus’s booking analytics approach demonstrates for route-level planning, creates a richer signal than volume alone.
How does customer segmentation improve your scheduling strategy?
Segmenting your booking data by client type reveals scheduling patterns that aggregate metrics hide. A repeat client who books 3 days in advance behaves very differently from a first-time client who books 3 weeks out, and treating them identically in your scheduling strategy wastes capacity.
Useful segmentation dimensions: new vs. returning clients, booking channel, lead time band (0–3 days, 4–14 days, 15+ days), service type, and average spend. Once segmented, you can assign slot types: hold premium same-week slots for high-ABV repeat clients and open longer-lead slots to acquisition-focused promotions.
Multi-period trend comparison and interactive filtering make it practical to compare segment behavior across quarters without building custom reports from scratch. The insight that matters most is usually which segment drives your highest completion rate, because that is the segment worth protecting with priority scheduling.
What metrics should small service businesses prioritize first?
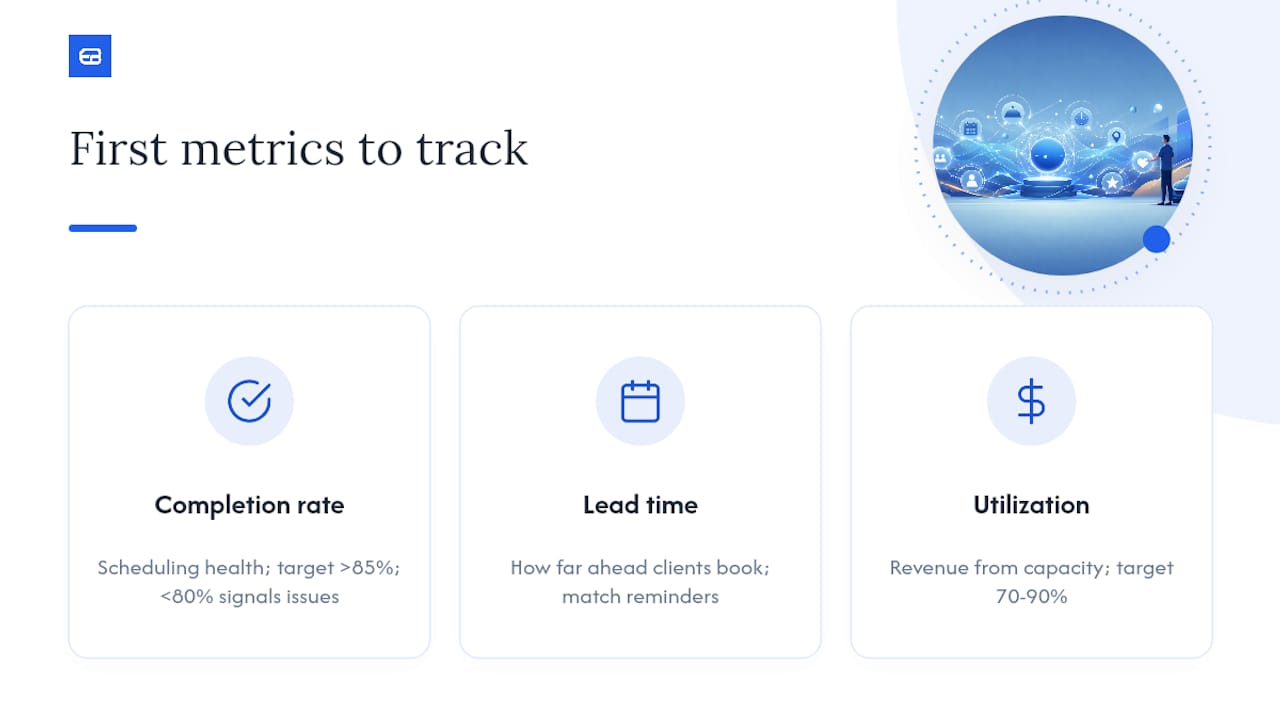
Completion rate, average lead time, and resource utilization are the three metrics that deliver the most diagnostic power for small service operations, and they are the right place to start before adding anything else.
Completion rate tells you whether your scheduling system is working at all. A rate below 80% means something structural is broken, whether that is a reminder gap, a cancellation policy problem, or a mismatch between slot length and service duration. Lead time tells you how far in advance your clients plan, which directly shapes how much notice you have to adjust staffing. Utilization tells you whether you are making money from the capacity you already have.
The instinct to track everything at once is understandable but counterproductive. A business tracking nine metrics with dirty data learns less than one tracking three metrics with clean data. Get completion rate, lead time, and utilization right for 30 days. Add cancellation rate and booking velocity in month two. Introduce predictive layers only after you have a stable baseline.
Realistic near-term targets: completion rate above 85%, utilization between 70% and 90%, and a lead-time distribution that matches your reminder cadence. Expressbook’s AI analytics and scheduling software guide give small businesses a practical starting point without requiring a data team.
Expressbook: built for service businesses that want data, not guesswork
Expressbook gives service businesses, from solo practitioners to multi-location studios, a scheduling platform where booking performance indicators are built in, not bolted on.
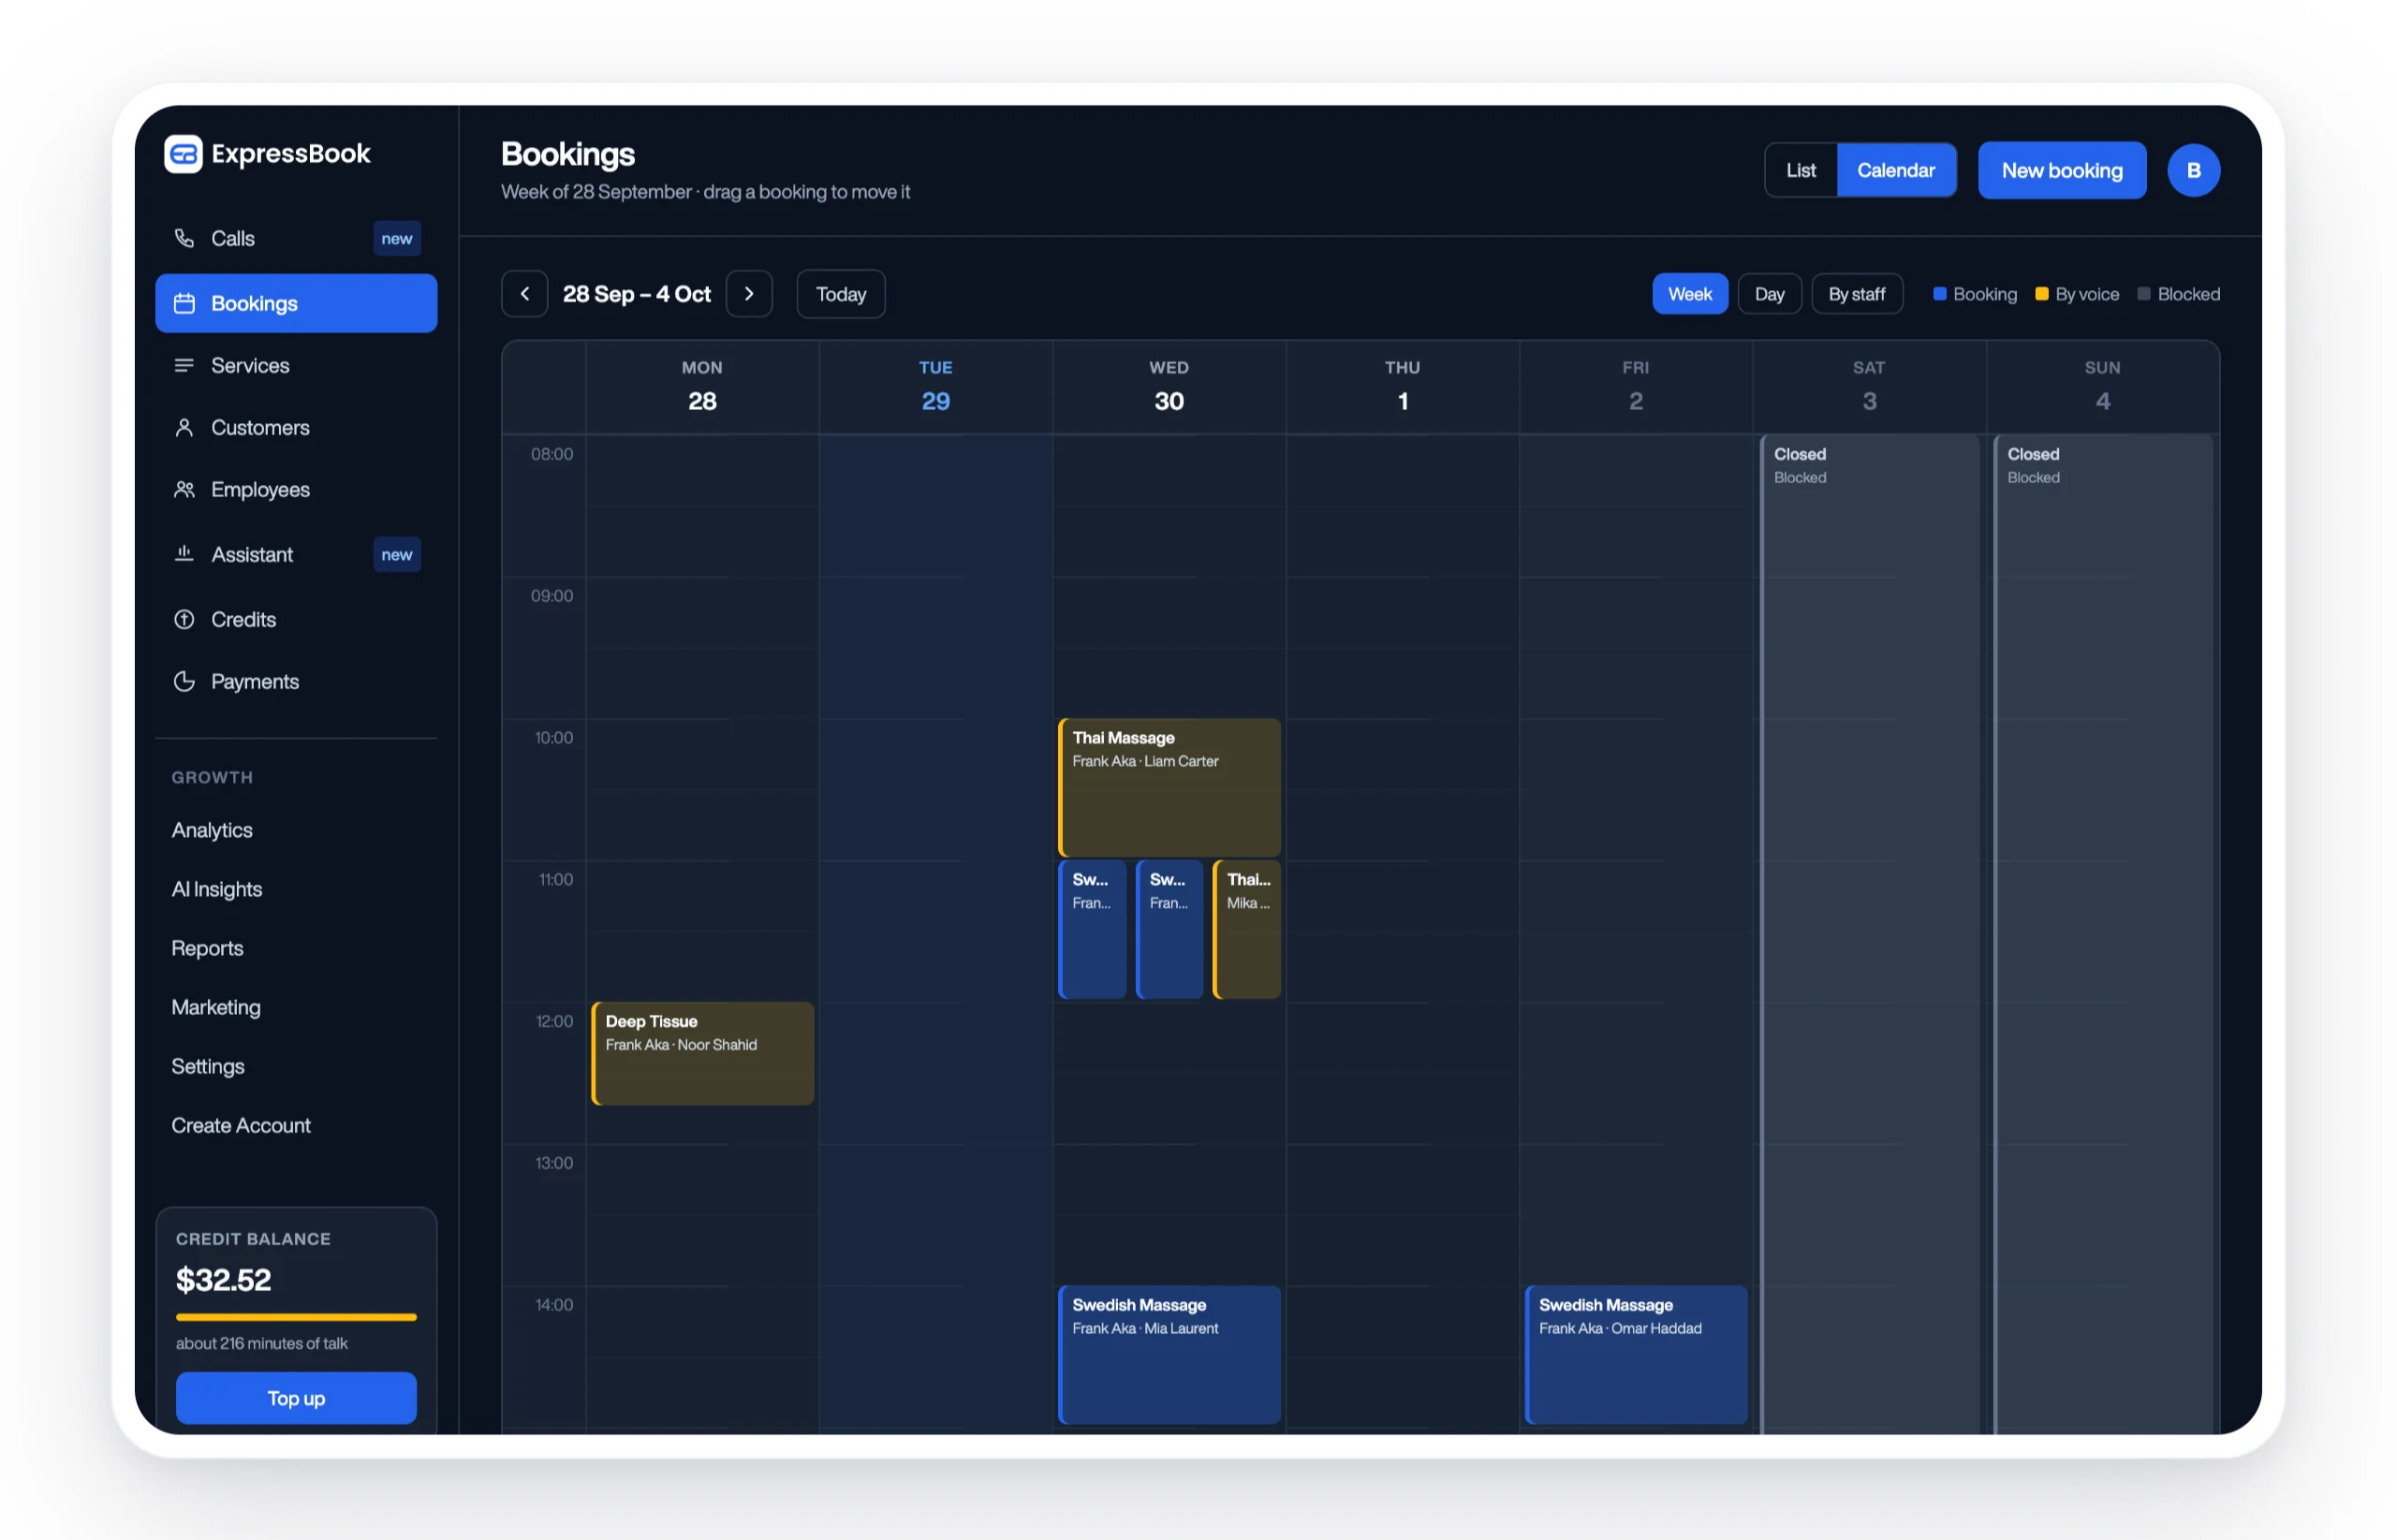
Real-time availability prevents double-bookings before they happen. Automated reminders cut no-show rates without manual follow-up. The QuickBooks and Xero sync keeps revenue data clean so your ABV and completion rate calculations stay accurate. The dedicated mobile app and voice agent capture every booking, including same-day and accessibility-driven appointments, so your channel mix data is complete from day one.
Expressbook claims to save users over 10 hours per week in administrative work. There is no subscription, so you can complete the full 30–90 day implementation plan on prepaid credits and see measurable results. Set it up, enable calendar sync and reminders in week one, and run your first baseline report within 30 days.
Expressbook is the scheduling platform this article was written around
If the playbooks above describe exactly the problems you are trying to solve, Expressbook is the platform built to execute them. Real-time availability, AI analytics, automated reminders, and direct accounting integration are all included, not sold as add-ons.
There is no subscription, so the full 30–90 day implementation timeline described in this article runs on prepaid credits. No long-term commitment is required to start. Sign up, connect your calendar, and run your first baseline report this week.
Sources
- Booking Data Analytics | Amadeus
- Airline Booking Analytics | Flight Analytics | OAG
- Booking Reports – Analyze Reservation Patterns | RecSystems Help
- Booking Analytics: for the entrepreneur of tomorrow.